Site & API Monitoring
Monitors run your scripts on a regular schedule to make sure your site stays alive and functional.
Monitoring is different from load testing. A monitor runs a script on a schedule with a single bot at a time, while a load test typically runs hundreds or thousands of bots concurrently to see how your site handles the heavy load. Both are important if you’re concerned about your site’s performance and uptime.
Luckily, you can often reuse the same Loadster scripts for both load testing and monitoring! The user journeys and site features that you load test are often the same ones you’ll want to monitor, so in many cases you can use the exact same scripts or copies with minor modifications.
If your monitors detect a problem with the site, Loadster can notify you and your team via your choice of email, SMS, robocalls, and integrations with other tools.
Immediate detection of any site downtime or breakage is critical if you want to maintain high uptime and resolve problems with your site quickly.
Monitor Setup & Configuration
Setting up a monitor involves choosing which of your scripts should run, how often, and from which cloud regions or self-hosted engines.
You can also set thresholds for incident escalation and choose how you’d like to be notified of any incidents.
Creating a monitor
Monitors live within a Loadster project alongside your scripts, scenarios, datasets, and load test reports. To create a new monitor, go to a project and expand the add menu, and select New Monitor.
You’ll need to make up a name for the monitor that’s unique within the project, and designate a script that the monitor will run. If your project doesn’t have any scripts yet, you’ll need to create one first before creating a monitor.
After you create a monitor Loadster will schedule it to run. You should have results from the first monitor cycle shortly!
Editing a monitor script
Each monitor is tied to a script in the same project. It runs that script with every monitor cycle. You can edit the script at any time if you’d like to change the steps that the monitor takes when monitoring your site.
Editing a monitoring script is the same as editing any other script. Just keep in mind that editing a monitor script will also affect any other monitors that might be using the same script, and also any load test scenarios that might reference that script.
While scripts are reusable, you might want to create a dedicated script for each monitor if you’re concerned about edits impacting your load tests and other monitors.
Setting a monitor schedule
By default, newly created monitors start with an hourly schedule. That means the monitor will run your script every hour. You can change the monitor frequency from the monitor configuration bar at the top of the page, ranging from every minute to every day.
Higher frequency monitoring (up to every minute) is best for detecting and responding to problems quickly, but might also impact your fuel usage. You can select different schedules for each monitor. You might want to test the most critical components of your site on a faster schedule while testing less important flows less frequently.
Selecting monitoring locations
A monitor can run from one or more locations. These geographical locations are where the bots running your monitoring scripts are located.
Loadster has monitoring regions on several continents. It’s a good idea to choose a region where most of your customers are located, to make sure your site stays reachable from that region. If you prefer, you can specify multiple regions so your monitors alternate between them from one cycle to the next.
You can also run monitors from a self-hosted Loadster Engine if you want to monitor a site that isn’t publicly accessible or you want to make sure it remains accessible from a very specific location.
If your monitor has multiple locations selected, cycles will alternate between them.
Monitoring alerts and notifications
Each monitor cycle records a status on completion. You can view a history of cycle statuses on the monitor page.
Ideally, the status will be PASS every time, meaning that the script completed successfully and without errors. If the script runs and encounters errors, the cycle status will be FAIL.
If the script can’t run because of a misconfiguration or usage limit or some other reason, you might see a less common status like ERROR or THROTTLED or TIMEOUT. If this happens you can troubleshoot the problem and get more info by visiting the monitor page.
Loadster detects when the monitor’s status changes from PASS to FAIL or vice versa. When a monitor fails that was previously passing, Loadster opens an incident.
By default, an incident is opened after a single failing cycle, and it is resolved after a single passing cycle. You can change this with the Escalate on Failure dropdown. You might want to set it to 2+ cycles to avoid being alerted in the event of a short hiccup, but if every failure is critical you can keep the default setting of 1.
Read more about Incidents & Notifications to customize incident creation and resolution, and control how you will be notified of monitoring incidents.
Tagging monitors
You can optionally apply tags to monitors if you want to group or classify them a certain way. You can make up your own tag names.
Maybe you’ll want to tag them by environment, like production and staging, or you might want to tag them by what
component of your site they pertain to, like Website and API.
A monitor can have multiple tags applied to it.
Historical Monitoring Data
Monitors continuously keep track of time periods when the monitor was passing and failing.
You can review this historical monitoring data after the fact to see how your site has performed over time, track uptime and downtime, and investigate any incidents that your monitors have detected.
Reviewing your historical monitoring data
When viewing an individual monitor, you can see that monitor’s historical record of passing and failing cycles in detail.
Monitoring data is also available in aggregate for all your monitors on the centralized Monitoring page.
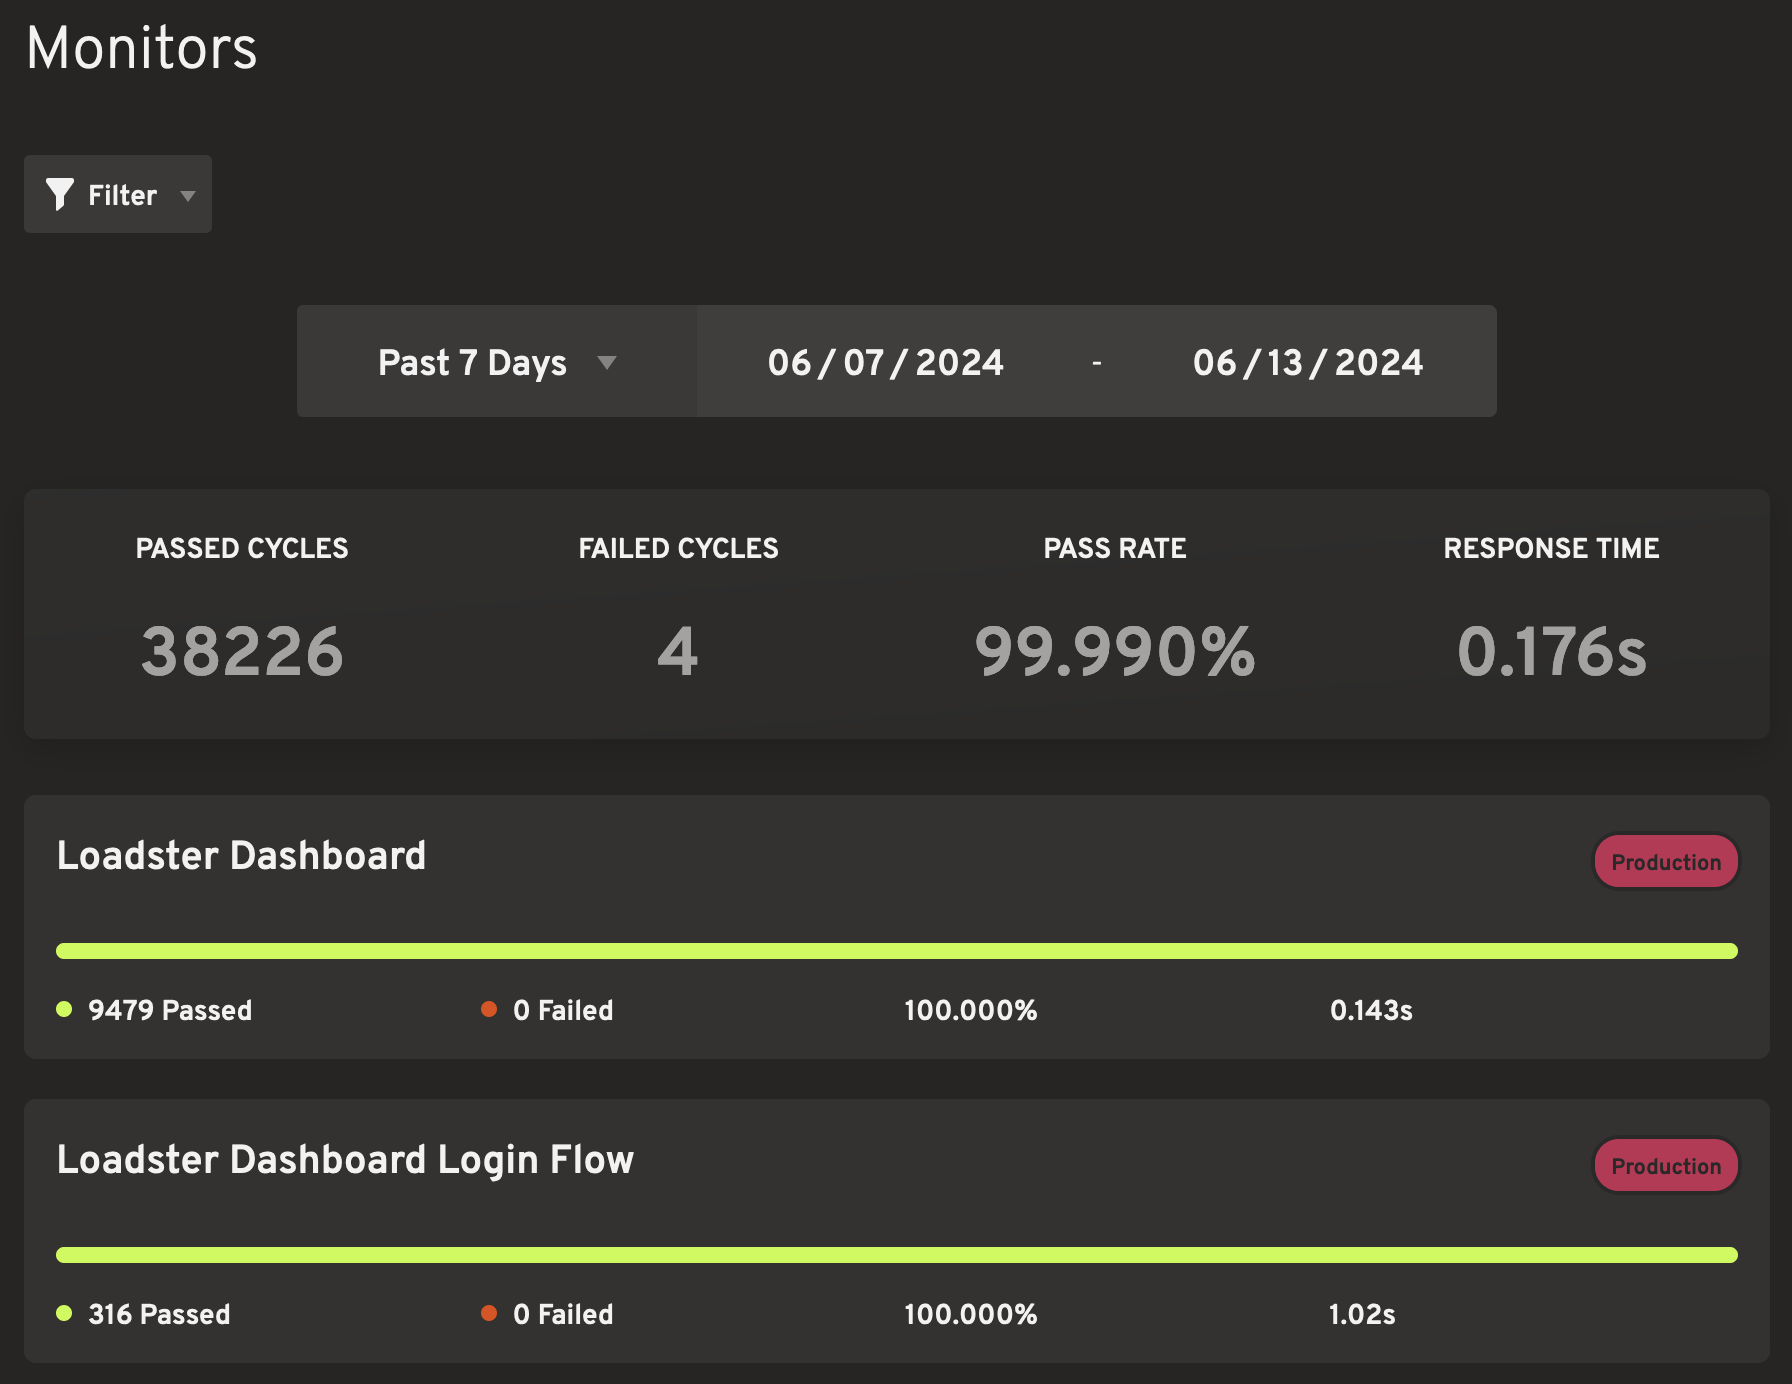
Normally, the monitoring dashboard will be your starting point when looking to see how all your monitors are running and reviewing your site’s uptime.
Filtering and pinning monitors
The monitoring dashboard lists all your monitors, but you can filter them if you only want to see certain monitors together. You can even apply multiple filters at the same time.

The supported filters include:
- Filter by project to see only monitors in a given project.
- Filter by status to see only monitors with a certain status, like PASS or FAIL. Keep in mind this filter may match different monitors at different times, depending on their current status.
- Filter by tags allows you to show monitors that you’ve tagged a certain way.
If you find yourself using certain filters frequently, you can pin the filtered view to the sidebar and give it a name, so you can easily view your monitors with the same filters in the future.
Comparing monitor performance over time
When you’re looking at an individual monitor, you’ll see graphs showing the historical performance and status within a date range.
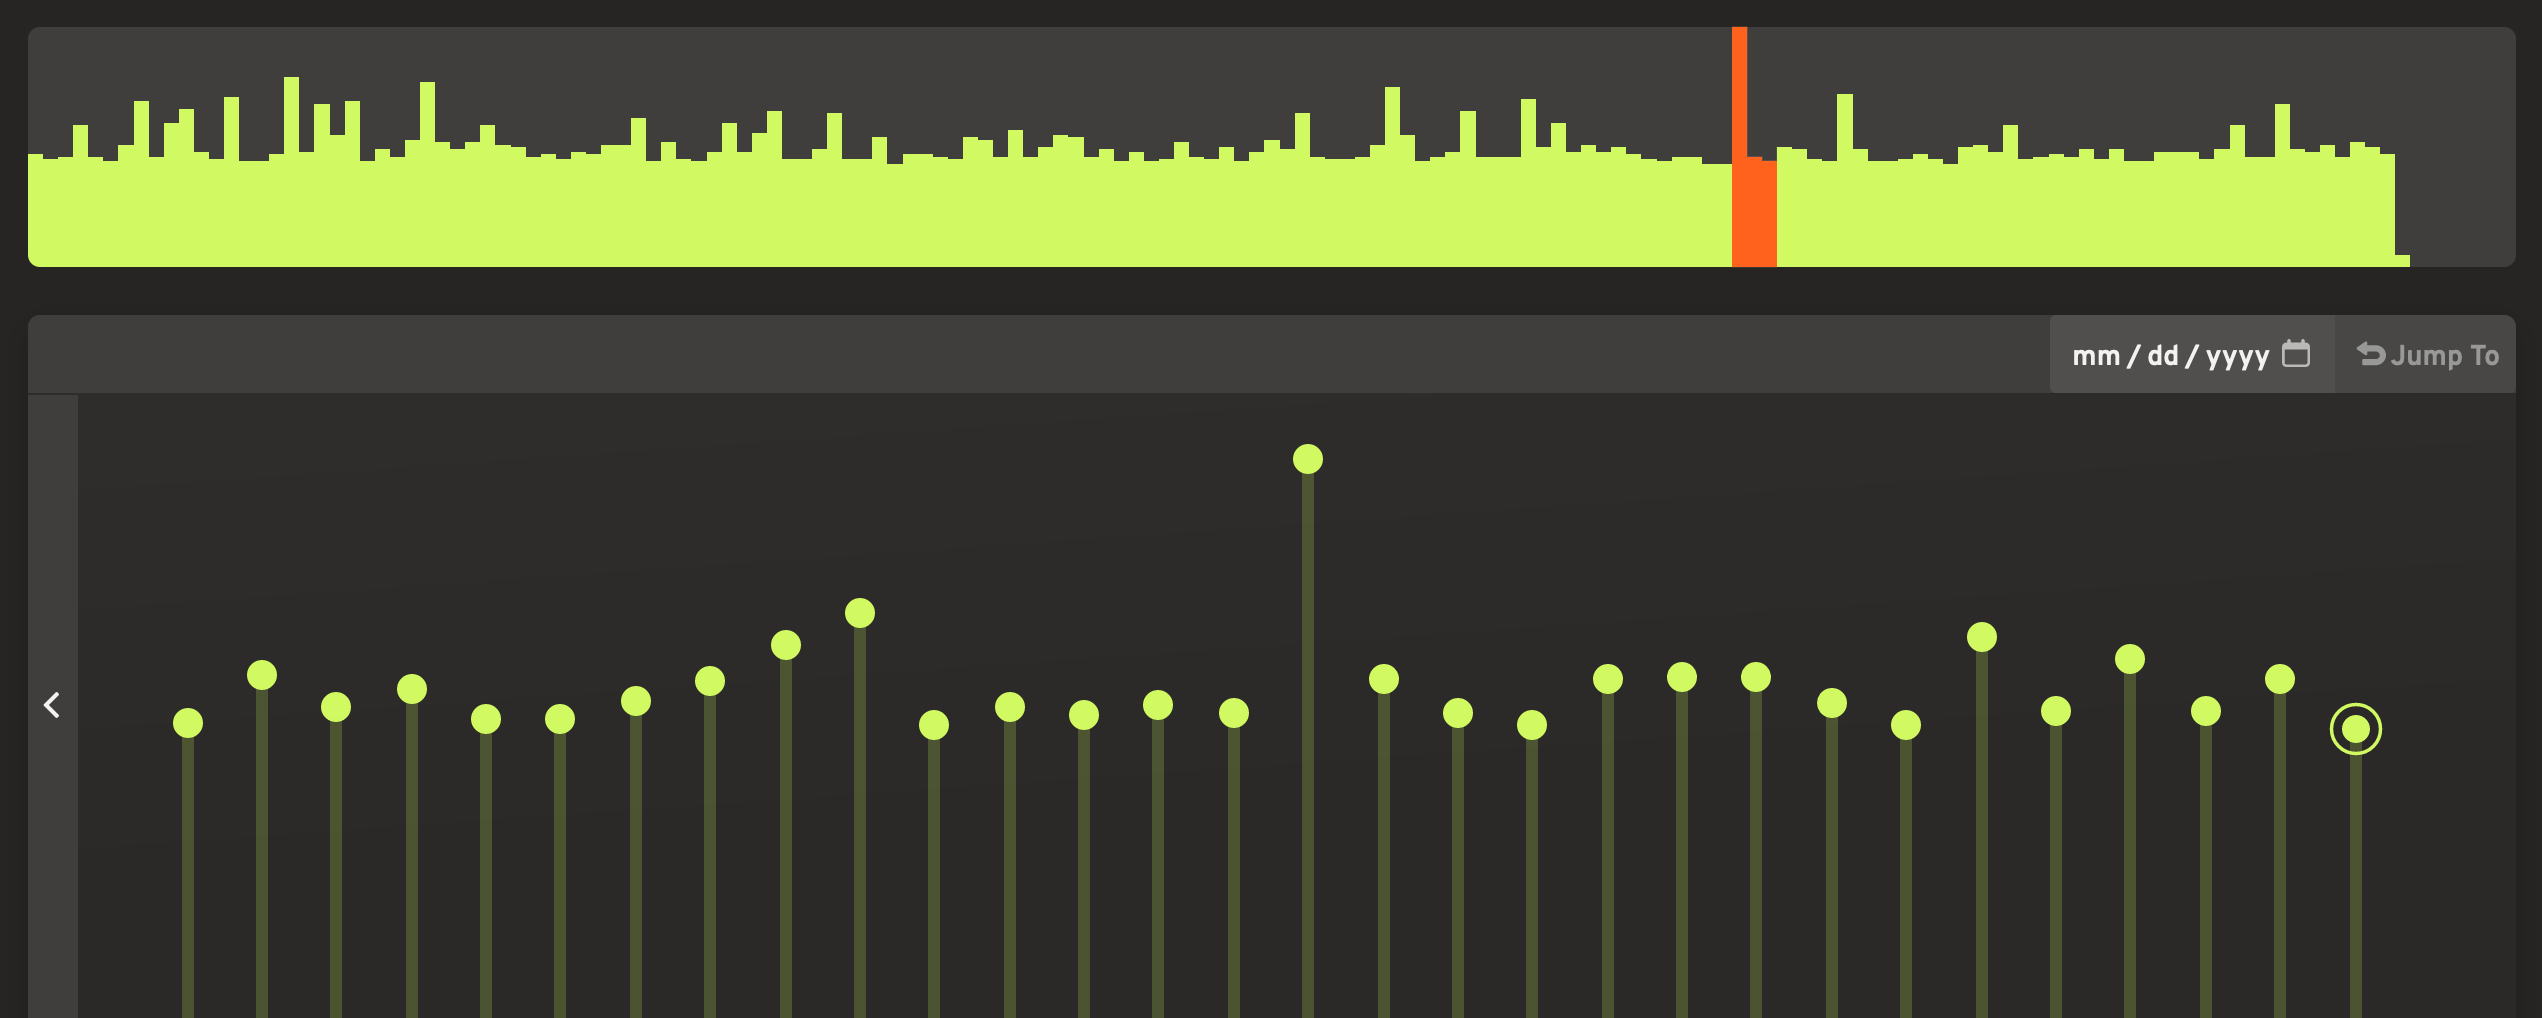
The height of the bars represents the average response time or page load time of each monitor cycle. Of course, each cycle might be measuring multiple requests, so you’ll need to investigate further if you want to see performance at the individual request level, but the height of the bar is an easy way to compare relative performance from one cycle to the next or at different times of day.
The color of the bars indicates the monitor status during each time period.
You can hover and click on the bars for more information and to jump to cycles in that time range.
Drilling down on monitor cycles
Clicking on a bar on the upper graph focuses the lower graph on the cycles in that period. Clicking on an individual cycle brings up that cycle’s script run results.
Loadster retains each cycle’s full script run for several weeks so you can go back and investigate any errors. Along with the script logs, you can look at screenshots (in the case of browser scripts) and drill down to detailed requests and responses (in the case of protocol scripts).
The level of detail you get about each completed monitoring cycle is the same as when you play the script yourself in the script editor.
Viewing monitor logs, timelines, and results
When you drill down to an individual monitor cycle you’ll be able to see the monitor’s logs, just like you saw when playing your script in the script editor.
For protocol scripts, you’ll also see a Results tab with a tree of requests and responses, which you can use to see exactly what was transmitted between the protocol bot and your server.
For browser scripts, you’ll see a Timeline tab with screenshot tiles representing each action in your script. You can expand these to show full-page screenshots and other information about the monitor cycle, just like you did when creating the script.
Monitoring Plans & Fuel
Loadster monitoring can be done with your choice of pay-as-you-go Loadster Fuel or with a predictable monthly plan, similar to load testing. If you don’t have a monitoring subscription your monitors will simply burn a little fuel with each cycle and you can add more fuel when it runs low.
Monitoring with Loadster Fuel
If you don’t have a monitoring plan, every time a monitor runs it burns Loadster Fuel. The amount of fuel burned depends on the type and duration of the monitoring script.
With each monitoring cycle, protocol scripts burn fuel at a rate of 1 unit per bot hour and browser scripts burn fuel at a rate of 4 units per bot hour, just like load tests. However, since monitoring scripts are typically short and run for just a few seconds each cycle, they end up using a tiny fraction of a fuel unit per cycle.
You can view your actual fuel consumption for a given date range on your monitoring dashboard or on each individual monitor. Your Billing page also shows a breakdown of monitoring fuel usage by project each month.
Monitoring with a subscription
Some Loadster plans cover monitoring without burning any fuel. When you have an active subscription to one of these plans, any monitors that run within your plan limits are fully covered by the plan and do not consume fuel.
Monitoring with a subscription tends to be more predictable and is often more cost-effective than fuel, especially if you have lots of monitors or they run frequently.
Please contact help@loadster.app if you’d like to inquire about a monitoring subscription or have other questions.