Continuous Integration and Load Testing
Continuous integration (CI) is a widely accepted way to speed up your software development process, by merging code frequently and testing through automation. Many teams run automated functional test suites as part of their build and deployment process.
It’s also a great idea to include load and performance testing in your continuous integration pipeline! Automating load tests with every build or deployment can help you detect performance regressions quickly, and also uncover certain kinds of bugs that might only surface when the system is under load.
Load Test Triggers
Every one of your Loadster scenarios has a unique trigger code or URL that you can use to remotely launch the test. You can find this trigger for a scenario by expanding the dropdown on the Launch Test button.

This trigger code is unique to the scenario, and does not require separate authentication apart from being long and random and difficult to guess, so be sure to keep it safe as you would any other secret credential.
Running Tests with the Loadster CLI
The Loadster CLI is the preferred way to launch Loadster tests from your CI pipeline, build server, or cron job. It’s available as a self-contained native binary for Windows, Mac, and Linux, and makes running and observing load tests a breeze.
Download the Loadster CLI for Windows, Mac, or Linux
To install it, simply download and extract the archive, and place the executable anywhere on your filesystem.
Starting a Test With the Loadster CLI
To run a test with the Loadster CLI in your PATH
, you’ll need the scenario’s trigger code as shown above.
You can then start a test with loadster start <trigger-code>
as shown here:
$ loadster start WsHDupkZEYkSD7bT
Test launched! To view it in your browser:
https://loadster.app/dashboard/projects/2e05873a-6119-426d-bf45-25858c7d797a/scenarios/bb5649b4-5233-4b6b-8064-e5adf2445e1f/tests/c0a1b914-ae07-46f3-85a2-ecd8566fa17c
Fetch the current test status as JSON at any time:
https://api.loadster.app/cloud/triggers/WsHDupkZEYkSD7bT/status/a76bd91f-a496-4d34-8849-1526a095634c
The CLI can also produce output in JSON format rather than human-friendly text, if you use the --json
switch:
$ loadster run WsHDupkZEYkSD7bT --json
{
"message": "Test launched!",
"reportUrl": "https://loadster.app/dashboard/projects/2e05873a-6119-426d-bf45-25858c7d797a/scenarios/bb5649b4-5233-4b6b-8064-e5adf2445e1f/tests/26a62f14-44ea-4aac-a925-1d937d12a7ee",
"statusUrl": "https://api.loadster.app/cloud/triggers/WsHDupkZEYkSD7bT/status/63f8c746-b33d-46ad-9de1-b7b641df7dce"
}
Including a Label
Sometimes it’s helpful to tie a load test back to a specific build number or configuration. You can do this with the
--label
switch.
$ loadster run WsHDupkZEYkSD7bT --label=ci-build-238-beta
Afterwards, this label will show up on the test report and in your Activity Feed, so you can easily reference load test results back to the relevant build.
Blocking and Observing Test Status
To make the CLI block until the test finishes instead of exiting immediately after starting the test, use
the run
command instead.
$ loadster run WsHDupkZEYkSD7bT # text output
$ loadster run WsHDupkZEYkSD7bT --json # json output
When you use the run
command (instead of the start
command), the CLI will keep watching the test progress, and
print useful stats every few seconds. For example:
[0:03:25]
- runningUsers: 175.00
- responseTimeAverage: 0.25
- responseTimeP90: 0.71
- uploadThroughputBytesPerSecond: 2437.50
- downloadThroughputBytesPerSecond: 190337.25
- pagesPerSecond: 11.08
- hitsPerSecond: 32.17
- totalPages: 2660.00
- totalHits: 11320.00
- totalErrors: 1.00
- totalIterations: 156.00
When the load test finishes, the CLI will exit.
Assertions
The Loadster CLI also supports assertions, so you can evaluate high-level test result metrics against pass-fail criteria. This is useful for automatically failing a build if the performance test results aren’t inline with expectations.
$ loadster run WsHDupkZEYkSD7bT --assert 'totalErrors == 0' --assert 'avgHitsPerSecond >= 24.5'
The example above makes two assertions: the total number of errors in the test must be equal to zero, and the average hits per second throughout the test must be more than 24.5. Assertions are not required, but you can use pretty much as many as you want.
Assertions work on the following metrics:
maxUsers
avgBytesPerSecond
maxBytesPerSecond
avgPagesPerSecond
maxPagesPerSecond
avgHitsPerSecond
maxHitsPerSecond
totalBytesTransferred
totalPages
totalHits
totalErrors
totalIterations
The following operators are supported in assertions:
==
<=
>=
<
>
At the end of the test, a breakdown of which assertions passed/failed is printed. If any assertions failed, the process exits with a non-zero status code.
Running Tests with Your HTTP Client
If you don’t want to use the Loadster CLI or it’s unavailable on your platform, you can also run and observe tests with your HTTP client of choice. For this example, we’ll use curl.
Starting a Test
Making a POST to your scenario’s trigger will cause it to start the test:
$ curl -X POST https://api.loadster.app/cloud/triggers/WsHDupkZEYkSD7bT
{
"message": "Test launched!",
"reportUrl": "https://loadster.app/dashboard/projects/2e05873a-6119-426d-bf45-25858c7d797e/scenarios/5390b231-40bd-4897-9922-733d2479e436/tests/2a8d9a67-2708-435a-8aec-5fc462323632",
"statusUrl":"https://api.loadster.app/cloud/triggers/WsHDupkZEYkSD7bT/status/15d27a12-f970-4c62-8284-485b48851cad"
}
The JSON response includes three things:
message
- A human-readable message, suitable for showing in a simple test runner UI or something.reportUrl
- A URL to the test report, where you can watch live as it runs, or view the final report once finished.statusUrl
- A URL for fetching the current test status (read on).
If you want to keep an eye on the test as it runs, or cause your CI process to wait for the test to finish, you or your CI script will want to make note of these URLs.
Including a Label
When starting a test with your own HTTP client, you can specify a label by including a label
parameter when you
POST to the trigger.
$ curl -X POST https://api.loadster.app/cloud/triggers/WsHDupkZEYkSD7bT?label=CI-BUILD-22-VERSION-0.18.1
Afterwards, this label will show up on the test report and in your Activity Feed, so you can easily reference load test results back to the relevant build.
Getting Test Status
Immediately after launching a test, you can query its current high-level status at any time by hitting
the statusUrl
that was returned by the trigger.
$ curl https://api.loadster.app/cloud/triggers/WsHDupkZEYkSD7bT/status/15d27a12-f970-4c62-8284-485b48851cad
{
"hitsPerSecond" : 24.6666666666667,
"downloadThroughputBytesPerSecond" : 7520,
"totalErrors" : 1754,
"pagesPerSecond" : 24.6666666666667,
"failed" : false,
"errorsByType" : {
"HTTP 404: Not Found" : 1755
},
"engines" : [
{
"id" : "a6ebd079-f4a2-4137-a23e-642dd2b27f10",
"online" : true,
"name" : "N. America - Virginia - 1",
"utilization" : 11.4286739959778,
"region" : "north-america-1"
}
],
"downloadBytes" : 554880,
"canceled" : false,
"uploadBytes" : 455220,
"responseTimeAverage" : 0.0390824742268041,
"elapsedTime" : 103997,
"populations" : [
{
"runningUsers" : 25,
"peakUsers" : 25,
"name" : "Population",
"id" : "f9f88cea-3226-4265-9c0a-94855687a0cb"
}
],
"totalIterations" : 1754,
"downloadThroughputBitsPerSecond" : 60160,
"responseTimeP80" : 0.065,
"running" : true,
"finished" : false,
"uploadThroughputBytesPerSecond" : 6171,
"responseTimeP90" : 0.0682,
"totalPages" : 1754,
"started" : true,
"totalHits" : 1754,
"uploadThroughputBitsPerSecond" : 49368
}
This status includes lots of interesting things to tell you how the test is running. The started
, running
, and
finished
booleans tell what stage it is in its lifecycle. If you need your continuous integration process to wait
for the test to complete, you could poll this status and wait until finished
is true
.
The other fields contain high-level metrics in your test, and they will change as the test runs. They contain a current snapshot of throughput, response times, errors, etc.
These numbers may occasionally be interesting to humans, but you could make your build script look at them too.
You could even configure your CI build to pass or fail depending on the outcome of the test.
For example, you could fail your build if there are errors (totalErrors > 0
) or too many slow responses
(responseTimeP90 > 1.5
).
Tracking Test Results from Continuous Integration
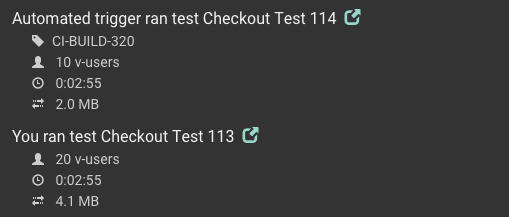
Finished tests will show up in the Activity Feed of your dashboard, alongside tests that were started manually by you and others on your team.

Examples of CI/CD Tools
While the basic approach to load testing is similar for any CI tool, the implementation will be different from one tool to the next. Here are a few examples to get you started.
Integrating Loadster with Azure DevOps Pipelines
Azure DevOps Pipelines stores build configurations in a file called azure-pipelines.yml
at the root
of your project. Here’s an example of that file that installs the Loadster CLI locally and uses it to run
a load test. You’ll need to replace j0PYS8ehQRt4AUVL
with the scenario trigger code from your scenario.
trigger:
- rmaster
pool:
vmImage: ubuntu-latest
steps:
- script: |
curl -L -o loadster-cli.zip https://github.com/loadster/loadster-cli/releases/download/1.4.1/loadster-cli-1.4.1-linux-x64.zip
unzip loadster-cli.zip
cd loadster-cli-1.4.1-linux-x64
./loadster run j0PYS8ehQRt4AUVL
displayName: 'Run a load test'
As the test runs, you can watch the logs from Azure DevOps Pipelines to see how it’s going. After the test finishes, Azure DevOps Pipelines will store the logs along with a link to view the test report in your browser.
Depending on how often you want to run your load tests, you might want to create a separate pipeline just to run the load test, or you might want to append these steps to an existing pipeline to run the test with each build or after each deployment.
Integrating Loadster with CircleCI
CircleCI looks for the build configuration in a .circleci/config.yml
file in your project. This example shows how
to install the Loadster CLI locally and run a load test as part of each build. You’ll need to replace
j0PYS8ehQRt4AUVL
with the unique trigger code from your Loadster scenario.
version: 2.1
jobs:
loadtest:
docker:
- image: buildpack-deps:trusty
working_directory: ~/repo
steps:
- run: |
curl -L -o loadster-cli.zip https://github.com/loadster/loadster-cli/releases/download/1.4.1/loadster-cli-1.4.1-linux-x64.zip
unzip loadster-cli.zip
cd loadster-cli-1.4.1-linux-x64
./loadster run j0PYS8ehQRt4AUVL
workflows:
version: 2
commit:
jobs:
- loadtest
nightly:
triggers:
- schedule:
cron: "5 0 * * *"
filters:
branches:
only:
- master
jobs:
- loadtest
In this example, we’ve defined a job called loadtest
, and we’re calling it after every commit and also running it nightly
at 12:05 AM with the cron expression. In real life, you may want to append this job to an existing workflow or call
it after every deployment instead.
As the test runs, CircleCI will display logs from the Loadster CLI so you can observe how the test is going. CircleCI will also store the logs with the build results, including a link you can use to view the full test report in your browser.
Continuous Integration Next Steps
There are a million ways to do continuous integration, and we haven’t tried all of them. If you have feature requests or questions, please get in touch with help@loadster.app and let’s work together on it!