Running Load Tests
When you launch a test from your scenario, Loadster will display a dashboard showing the real-time results.
Observing Your Load Test
The dashboard has a sidebar with high-level gauges and metrics, and a collection of charts and tables. You can use these to find out how your test is doing and watch for errors. Clicking on sections in the sidebar focuses different graphs and tables.
If you notice problems, you can stop the test. Otherwise, the test will run for planned duration and then exit on its own.
Response Times
The Response Times section is one of the key indicators of how well your application or site performs under load. These are a very close approximation of how long your real users would have to wait for a page or endpoint to respond, under load conditions similar to what your test is simulating.
The avg value here is a simple weighted average response time of all steps across all bot groups in your test.
The p80 and p90 values are an approximation of the 80th and 90th percentile response times. Loadster calculates them first at the group level (returning a percentile for each group) and then averaging the percentile across each group. While not quite a true percentile of all individual values, this approach meets a similar need while being much less computationally intensive.
The Average Load Time by URL graph is useful so you can see which of your pages/URLs are slower. In all but the simplest sites, certain pages tend to account for the bulk of the slowness. Slow pages are often your best optimization candidates. The term “page” is used loosely here and can also refer to an endpoint or anything else represented by a URL.
The Response Time Percentiles graph shows a rolling aggregate of response time percentiles across all the URLs in your test. These are broken down by the 99th, 95th, 90th, 80th, and 50th (median) percentile. If these lines are close together, it suggests that response times are quite consistent; if they are far apart, it means that outliers are much slower than the median.
Network Throughput
This section tells how many bytes/bits are being sent and received across the network. The value is calculated based on the total size of each request sent (upload) and each response received (download). The calculation is based on a rolling window going back a few seconds.
The Network Throughput graph shows the rate of bytes and bits transferred per second throughout your test. Although Loadster mostly measures HTTP/HTTPS throughput (at the application layer), this should be a close approximation of actual throughput at the transport layer as well.
The Cumulative Network Throughput graph is the total number of bytes uploaded (requests) and downloaded (responses) in your test. Since the number reported is cumulative, it will climb throughout the test, especially during the peak load phase.
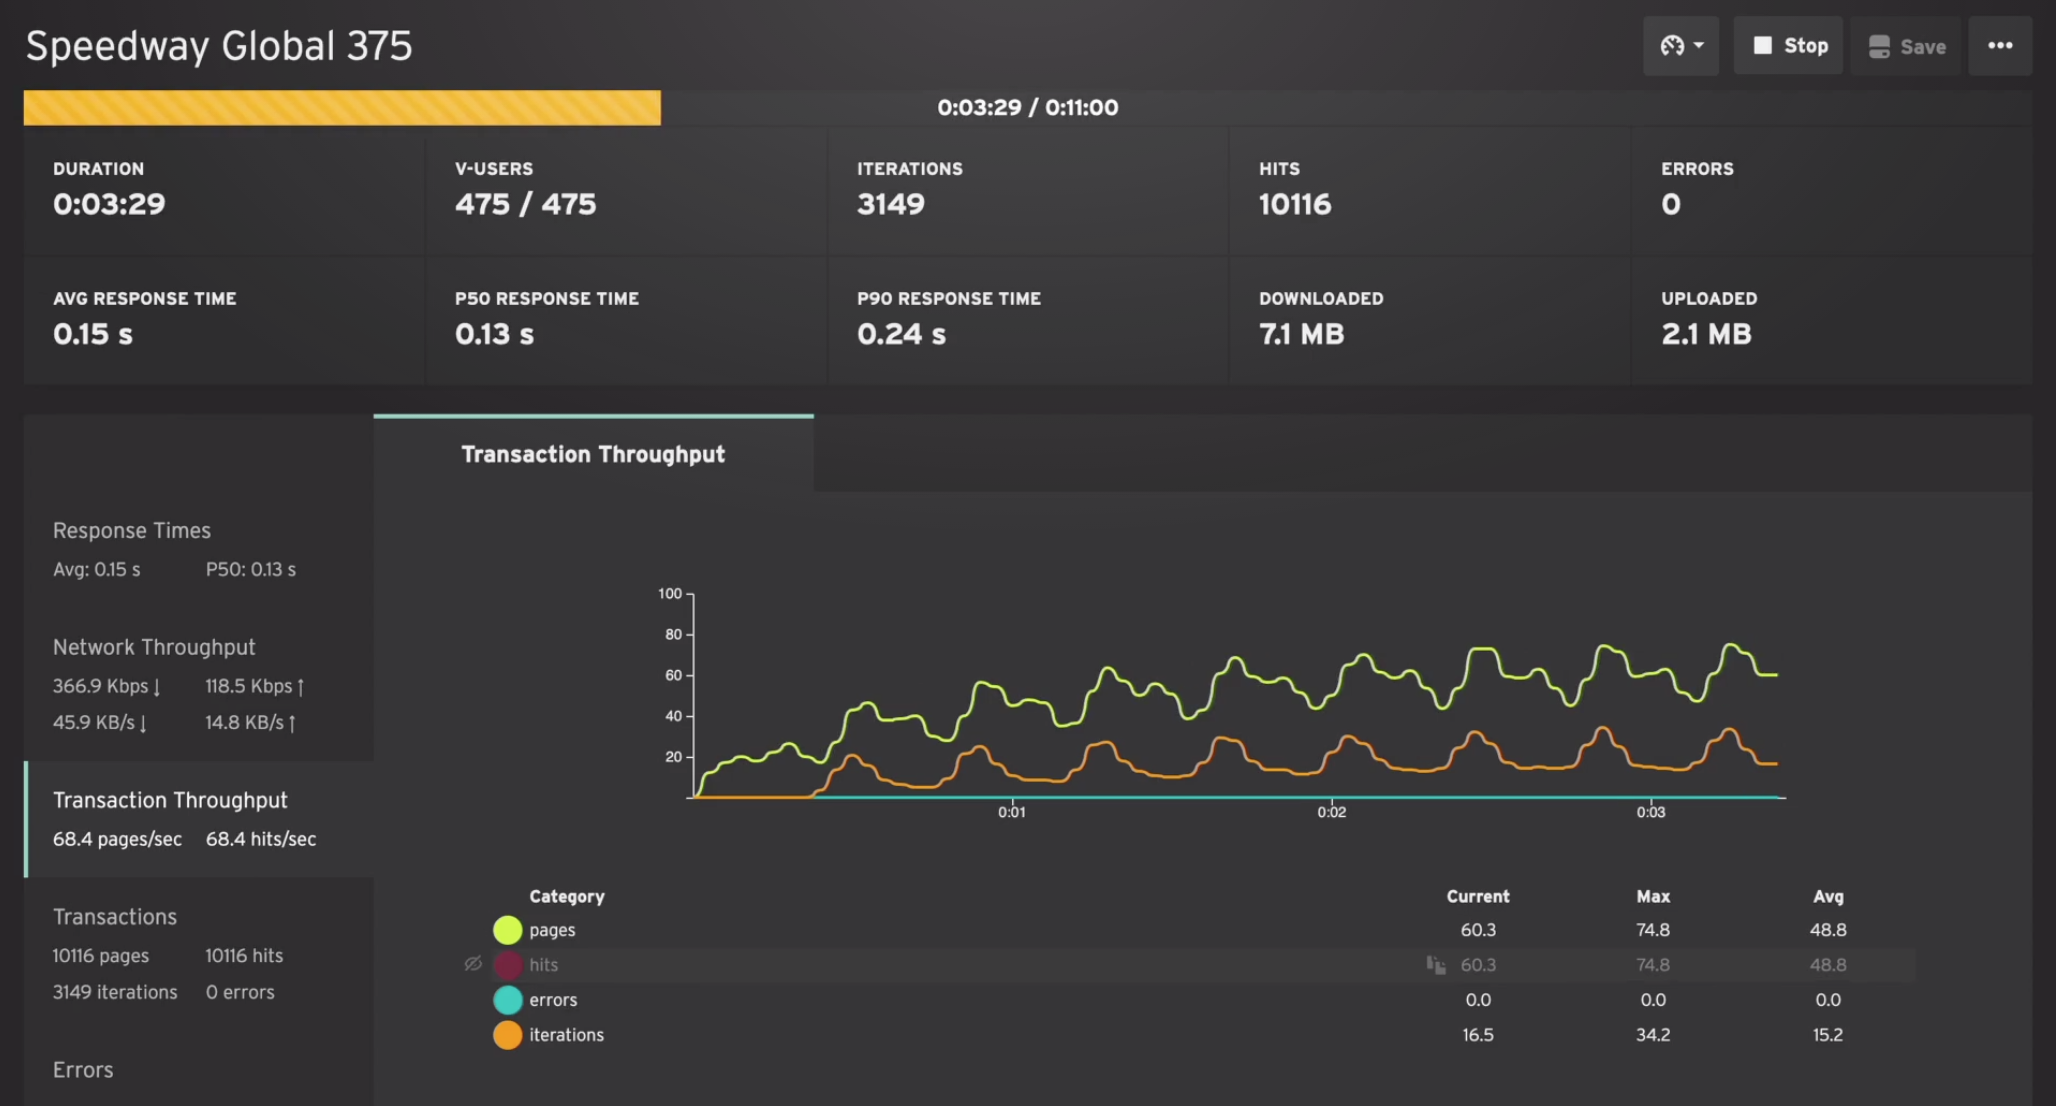
Transaction Throughput
This section shows how many transactions are being completed in a rolling window, broken down as pages per second and hits per second.
The Transaction Throughput graph is the rate of pages and hits per second over time.
Transactions
This section shows cumulative totals of pages, hits, iterations, and errors in the test.
Pages refers to any primary request made by a step in one of your scripts, whether or not the page had additional resources rolled up underneath it. It basically means the number of primary requests or navigations directly resulting from one of your steps.
Hits refers to any request made by a step, plus any additional resources that may have been loaded along with that step. It basically means the total number of HTTP requests to all destinations.
Iterations refers to how many complete iterations have been executed of any of your scripts. Each time a bot finishes an iteration of your script, it starts again, as long as there is time remaining in the test phase. The iteration count is a good indication of how many user sessions or user journeys have been simulated.
Errors refers to any protocol error, validation error, or other unexpected error. If the scripts are properly designed and the website you’re testing is handling the load gracefully, you should not see errors. If you do see errors, they probably warrant further investigation.
Clicking on the Transactions section in the sidebar focuses the related graphs.
The Transactions graph shows a cumulative count of the pages, hits, iterations, and errors in the test.
The Running Bots by Group graph shows, for each bot group, how many bots have been running at any point during the test. The ramp-up and ramp-down phase should resemble what you configured in your scenario. Bots may take a bit longer than planned to exit during the ramp-down phase, because they must complete the current iteration of their script before exiting.
Errors
The Errors section has graphs that show the type and location of errors over time.
The Errors by Type graph shows a count of errors broken down by the error message. It’s useful for seeing when the errors happened in the course of your load test. If a large spike of errors happens all at one moment, that may hint at a different underlying cause than errors spread evenly throughout the test.
The errors that show up here may include HTTP errors (any response with an HTTP 4xx or 5xx status), validation errors (which are thrown when a step fails one of your validation rules), or network errors such as socket timeouts or connection failures.
The Errors by URL graph shows a count of errors broken down by what URL they occurred on.
Traces
The Traces section provides more details about actions your bots take in a load test.
Browser Bot traces normally include the bot’s logs, a screenshot of what the browser was displaying at the moment the trace was taken, and a resource waterfall showing all the requests made by the page with their timings and size.
Protocol Bot traces also include the bot’s logs, along with the full HTTP request and response from the primary request.
Traces of type INFO are reported by the first bot in each group (Bot 0), and are useful as a sampling of requests regardless of whether the request was successful or not. Info traces provide some of the same information you might get when playing a script in the editor, but only for certain bots, since it would be cost and resource prohibitive to capture all this detailed information for every bot in a load test.
Traces of type ERROR are taken automatically when a bot detects an error. They normally include everything you would find in INFO traces, as well as error details that might help you figure out what went wrong.
The number of traces taken per test is limited, so if you are running a large test with many errors or many iterations, there’s no guarantee that every possible thing will be traced. Detailed traces are available during the test and for a few days afterwards.
Besides the traces that Loadster captures automatically, you can manually request an INFO trace in a
code block by calling bot.trace(). Any bot can generate them, but the total number of
traces will still be subject to the overall limits for each test.
Running Bots
The Running Bots section shows each of your bot groups. Next to each group name, it shows how many bots are currently running and the total number allocated. For example, if a total of 100 bots have been allocated but only 57 are currently running, it will show (57/100).
During the ramp-up phase and the ramp-down phase, it is normal to have only some of the bots running.
Load Engines
The Load Engines section shows each of the self-hosted load engines or cloud clusters that are running your test. If you have multiple bot groups and each is using a different engine or region, multiple lines will show up here.
Next to the load engine or cloud cluster’s name is a tiny graph with a high-level load average. The load average here is the overall “busyness” of the engine or cluster itself. This is important because an overloaded engine can sometimes report less accurate response times. Generally, as long as the engine isn’t maxed out, there is no cause for concern.
The Load Engine CPU Utilization graph shows how busy the CPU(s) are on each load engine or cluster. If the CPU remains 100% utilized for a significant amount of time, it can result in inaccurate response time measurements! If this happens, it may be a good idea to split the bot group into multiple smaller groups on different engines or clusters.
The Load Engine Thread Count graph is another measurement of how busy the load engine or cluster is. The thread count is directly correlated to how many bots the engine is running. Engines will always have at least one thread per bot, and more if the script calls for additional page resources to be downloaded in parallel with the primary request.
The Load Engine Memory Utilization graph tells how well the engine is managing its memory. This is rarely a problem, but things to look out for include very high memory usage (close to 100%) and extremely frequent garbage collection (lots of big spikes and drop-offs in the chart).
After the Load Test Finishes
After a test finishes (or you stop it prematurely), Loadster compiles the data it collected from the engines and stores it as a test report.
You can then open the test report for further analysis, or share with your team members. Learn more about this in Analyzing Test Results.